The high-quality CX trend has led many companies to try to improve customer relations. The problem is how to measure these relationships. We talk about this in a series of articles.
Hi! Most likely, you are here to read about loyalty metrics. This article is just one of the two parts of our guide. Here we talk about what loyalty is, how it is related to money and how to measure relationships between customer-business using metrics.
According to recent research, a loyal user is almost 5x times cheaper to attract than new customers and is very likely to return to you for purchases or clicks. That is why the largest companies in the world are building up good relationships with customers.
For example, according to Bain & Company, reducing the churn rate of customers by only 5% increases the company's revenue by 25-95%.
In this article, we will not only analyze what customer loyalty is but also tell you about most of the metrics that will help you measure it and understand your growth points.
What is customer loyalty?
This question is not an easy one. The most important thing that characterizes loyalty is a long–term business-client relationship. It consists of at least four main factors:
- The client is ready to spend money on your products or services with some frequency.
Among competitors, they tend to choose your company.
- Loyal customers are the promoters of the company. They will recommend your products to friends and colleagues.
- The so-called client happiness is an obligatory factor. For example, a bookmaker's regular client suffering from ludomania is unlikely to enjoy interacting with the company but remains its loyal customer.
- Loyal customers tend to share the company's values, such as environmental protection or inclusivity.
As a rule, people are loyal to the brand because they associate it with a positive experience, for example, with excellent service. Constant positive interactions with the company form trust. This "airbag" will work if an unexpected mistake happens. In the case of a new client, you will have to try hard to keep them from going to competitors.
"People who have had a bad experience with the brand, but whose problem the company has fixed, are more loyal than customers who have never had problems."
Leonie Brown, Qualtrics XM Scientist
In which cases loyalty is not really loyalty? 🤔
In addition to the direct growth opportunities that we talked about at the beginning of the article, loyalty carries a hidden threat – it can blur your view. Often your regular customers are not loyal, but they are held either by contracts (in the case of mobile operators or utility companies) or inertia. For example, many customers who visit the same supermarket every week can look at competitors who have a discount on the goods they need.
In this case, you should rely on the Share of Wallet (SOW) metrics. SOW is how much a consumer regularly spends on a specific brand compared to its competitors. Companies from business areas where customer constancy does not mean high loyalty try to grow this metric.
So decent revenue doesn't always mean clients will stay with you if a competitor makes them a better offer.
Often, loyalty is associated with products like cars, clothes, or smartphones. In this case, customers are loyal because they associate a product or brand with their identity. Again, the "attachment" to the company is not directly related to the constant money spending.
Why is customer loyalty essential?
Customer loyalty is crucial for a lot of reasons. For example, efforts to retain an existing customer are significantly lower than to attract a new one. Why would you spend extra money if you don't have to?
60-70% are the chances of converting an existing customer
according to Marketing Metrics
In addition, it is much more difficult to convince new customers to buy, because they know too little about your company. And this means that you need not only to make your brand known but also to navigate customers through the marketing funnel.
Therefore, the more repetitive sales you have, the less money you will need to spend on various conversion schemes, such as discounts on goods from an abandoned cart.
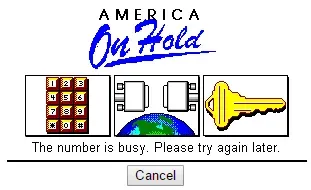
To demonstrate the importance of customer loyalty, the history of AOL is noteworthy. In the 90s, the Internet provider rapidly grew and provided access to the network to almost half of US households. In addition, it owned popular content platforms, a browser, and an email service.
But instead of gaining a foothold in the market and retaining loyal customers, America Online invested more and more money in promoting and winning new users. As a result, the company's operating systems went down. The nickname America On Hold stuck to America Online for many years due to constant network outages, sometimes lasting for several days.
Even its adherents began to turn away from the company. During the year 1999, the outflow of customers grew up to 72% (!), and in the long term, the company missed the chance to become an equal competitor to Google. It is clear that the thousands of factors led to such a situation, but you can't deny that the failure in the late 90s hit the company's reputation hard.
Loyalty and money
In the end, everything is still focused on money – we can't get away from this paragraph in the article! Yes, high revenue does not always mean that your customers will not leave for competitors at the first opportunity. As well, as strong relationships with users do not guarantee you the automatic growth of business metrics. But it is pointless to deny the correlation.
Some statistics from Temkin Group Research on NPS and promoters:
- The probability that the promoters will repurchase the product is 5x times higher than for all other users.
- They are 7x times more likely to forgive some of your mistakes than others.
- They are open to new offers, trying offers 9x times more often than others.
You can't underestimate the word-of-mouth power. It brings in more than $6 trillion to companies annually and generates 13% of all sales. And finally, according to Nielsen's research, 83% of respondents trust the recommendations of family members and friends more than any other form of advertising.
Customer loyalty, therefore, also allows you to plan effectively. Loyal customers buy with enviable regularity. So the company's growth becomes more predictable.
Why measure loyalty?
We have given several reasons why customers become loyal. But in fact, this is not a 100% story. Each user's case is unique. Some customers are more loyal than others. They may be strongly committed to you at some stage and then lose this fuse. Or vice versa – suddenly turn from neutrals into promoters. It may also be that customers are constantly buying something from you, but they do not show any other signs of loyalty. They do not recommend the company to friends or do not write positive reviews.
Because of all this complexity and the strength of customer loyalty, it is crucial to measure it over time. Many metrics will help you with this, which we will tell you about in two parts of this guide.
Metrics allow you to understand which segments of your audience should be a priority, what drives patterns of loyal customer behavior, and how you can improve the situation. And it does not matter at all whether you work in a multinational corporation or a small startup. This knowledge and insights will not be excessive.
How to measure customer loyalty?
Since loyalty is at the junction of emotions and money, it is not so easy to measure it. The synthesis of loyalty (CX) and business metrics will help us. This tandem will allow you to track trends regarding loyalty and turn this data into insights.
Let's take note that in this article, we will discover only metrics tied to loyalty.
Business metrics
CLV – Customer Lifetime Value
What it measures: A customer's lifetime value is the expected amount of money a customer can spend on your products during their lifetime.
Why measure: this figure allows you to decide how much money you need to attract new customers and how much to retain current ones.
For example, the CLV of the owner of a Ford car can be around 100 thousand dollars if he is satisfied with his purchase and acquires several other models during his lifetime. The coffee lover's CLV can be even higher, depending on how many cups of coffee he drinks daily and where he buys it.
If we take the concept of CLV more broadly, this is the potential profit that you can get from a specific relationship with a client. This metric gives you an understanding of whether the game is worth the candle. For example, if the client's CLV is 200$, do you need to spend more to keep him? It is simply unprofitable for you.
How to measure: CLV = average receipt * the number of times the user will make purchases in a year * the average length of the relationship with the customer (in years).
A marathon runner who regularly buys sneakers in your store can cost: 100$ per pair X 4 pairs per year X 8 years = 3200$. Or the newborn's mother: 50$ per pair X 5 pairs per year X 3 years = 750$. Who should be your retention priority? Runners.
Churn Rate
What it measures: Churn rate is the percentage of customers or subscribers who stop using your company's services or cancel their subscription within a certain period.
Why measure: The churn rate is vital for companies whose customers pay them regularly. If your typical client exits earlier than your average cost of attracting a new client recoups, you have problems.
How to measure:
- Define a period (week, month, year).
- Determine how many active customers there were during this period.
- Determine how many customers have left or stopped using the services during the same period.
- Divide the number of lost customers by the number of active customers.
- Multiply by 100%.
For example, a software company attracted 500 customers in the previous quarter. But it lost 50 users whose contract ended or those who left for a competitor because of poor service. Divide 50 by 500 and multiply by 100% – the churn rate is 10%.
What is a good value: the gold standard in the SaaS market is a bar of 5-7% churn per year. Moreover, the larger the company, the lower its churn rate since they work mainly with the enterprise segment, where contracts last much longer.
Of course, everything also depends on the business sphere. Here is a list of some industries and their annual averages:
Credits – 20%;
Retail banks – 20-25%;
Mobile operators – 20-38%;
SaaS – 5-7%.
How to improve the value: study the reasons for the churn. Find out from the customers themselves why they quit on your product. For example, after canceling the subscription, ask why it happened, call them for an interview or send a request to participate in the email survey.
- Improve the onboarding process. Perhaps you should provide customers with more How-Tos and offer additional help or educational content.
- Invest in training sales and support departments. Your managers need to understand the core values of the product and communicate them to customers. If users don't get promised, they won't stay with you for long. And support staff should be aware of all the product details to assist as soon as possible.
Retention
What it measures: In contrast to the previous metric, retention is the ability of a company to maintain relationships with customers for some time. Retention is the percentage of customers remaining with you at the end of the selected period.
Why measure: retention not only shows the company's success in attracting new customers. It also shows the ability to satisfy current ones. In addition, it increases ROI and loyalty.
Here are a few reasons why retention is critical to your company's growth and success:
- Attracting a new client is 5-25x times more expensive than keeping the current one.
- A 5% increase in retention increases the company's revenue by 25-95%.
- "Saved" customers buy more often and spend more than new customers. They have internalized the values of a product or service and keep coming back again and again and again.
- Satisfied customers are more likely to recommend the company to friends and relatives, bringing new customers for free.
How to measure:
- Define a period (week, month, year).
- Determine how many active customers there were at the end of the selected period.
- Subtract from this the number of attracted new customers for this period.
- Divide the resulting number by the number of customers at the beginning of this period.
- Multiply by 100%.
For example, you had 44 clients at the beginning of the quarter. You attracted 12 new customers, and 13 quit during this period – by the end of the quarter, there were 43 (44+12-13). ((43 – 12) / 44) * 100% = 70% retention.
What is a good value: according to the latest data from Statista, in 2020, the average percantage for industries were as follows:
Retail: 63%;
Banks: 75%;
Telecom: 78%;
IT: 81%;
Insurance: 83%;
Professional services: 84%;
Media: 84%.
How to improve the value:
In the sales processes, show the successful cases of your clients. Customers should immediately understand whether you will help them solve their problems or not.
Form the right expectations as early as possible and not try to exaggerate them. In addition, conduct surveys of new customers about the reason for choosing you. This way, you will understand whether you are positioning the product correctly.
Create a roadmap for future relationships. Some compare client-business relationships with romantic ones. As in couples, you both with the customer should understand what comes next.
Use interchange to improve loyalty. Acts of kindness towards customers generate a sense of duty – a person wants to repay the company in the same manner. These can be gifts or pleasant gestures. For example, when a client completes the goal earlier than promised. Or when you do a little more than was agreed.
Redemption Rate
What it measures: Linked directly to loyalty programs, the Redemption Rate shows how well your program performs. It is the percentage of usage of all points/bonuses issued to users for a given period.
Why measure: This metric shows how well your loyalty program engages customers and makes them back for new purchases.
How to measure:
- Define a period (week, month, year).
- Determine how many bonuses were spent by users during this period.
- Determine how many bonuses you issued in total during this period.
- Divide the bonuses spent by the number of all issued.
- Multiply by 100%.
For example, you gave out 700,000 points for the current month, and users spent 70,000. (70 / 700) * 100% = 10%.
What is a good value: the global average is about 13%. At the same time, your program should last at least six months.
How to improve the value:
Give several opportunities to earn bonuses. It guarantees more involvement and enjoyment from the process. Programs that require social interaction to participate in provide the highest Redemption Rates. Customers are beginning to integrate your brand into their lives and discovering more reasons to stay loyal.
Offer rewards for subscribing on social networks. Research from Smile.io shows that such programs receive a redemption rate of 16% higher.
Show bonus reminders on the website and in the app. Often, users don't know about a loyalty program or forget about its advantages.
Repurchase Rate
What it measures: The Repurchase Rate is the percentage of users who made another order during the selected period. Several items in one order do not matter – only full-fledged one-time orders.
Why measure: Firstly, the metric shows how many customers tend to return to you for repeat orders. This way, you will be able to analyze the audience segments that are most valuable to you. Secondly, you will find out which products or services are most popular.
How to measure: The Repurchase Rate is calculated in two ways.
If you count customers who have made new orders, regardless of the number of these orders (maybe 1, 5, and 30), then divide the number of such customers who have made at least two purchases by the total number of customers for the selected period.
For example, you had 300 customers in this quarter. Thirty of them made at least two orders. (30 / 300) * 100% = 10% repeat purchases.
With the second method, you also count the number of orders. For example, you had the same 300 customers per quarter. 270 made one order, 15 – 2 orders, 10 – 3, and 5 customers – 4 orders. Then calculate: ((15*2+10*3+5*4) / 300) * 100% = 27% repeat purchases.
What is a good value: Meta Marketing director Alex Schult believes that for e-commerce, the ideal metric is 20-30%.
How to improve the value:
- Focus on mail campaigns. Support the customer's lifecycle with personalized emails. 56% of customers claim that such letters would lead them to repurchase much more willingly than ordinary ones.
- Armed with the Repurchase Rate and Redemption Rate from the previous paragraph, create a loyalty program.
- Think about gamification. Big brands have been using it in their marketing campaigns for a long time. Enter activity tables or leaderboards to encourage customers to make even more orders.
A few more business metrics
These metrics are less related to loyalty, more to money, but they are also worth mentioning.
- Average Order Value (AOV). AOV is the total revenue divided by the number of orders during the chosen period. It helps formulate average buying habits and find opportunities for upselling.
- Purchase frequency (PF). The purchase frequency shows how often customers place orders. It is another critical money metric because the higher the frequency of purchases, the greater the revenue. To calculate the metric, divide the total number of orders over some time by the number of unique customers.
- Profitability per Order (PPO). The Profitability per Order shows how much profit you get from each order. To calculate the metric, multiply the profit margin by the total revenue and divide it by the total number of orders.
- Repeat purchase probability (RPP). RPP is generally similar to the Repurchase Rate metric but is more predictive. The number of customers who have made X orders is divided by all customers. So you can calculate the probability of 2, 3, and so on repeat orders.
- Loyal Customer Rate (LCR). It is needed to determine the most loyal customers and give them a unique approach. To calculate the metric, divide the number of customers who have made 4+ orders for a given period by all customers.