The CES or Customer Effort Score metric answers the question: "How easy was it for the client to interact with the company?". For example, to place an order, get a refund and so on. With this metric, you can understand where the user has the most difficult time, and make their path easier by eliminating this or that problem.
It seems that creating this type of survey is easy: you ask a question about how easy it was for the client to get what they wanted, add a scale, and you're good to go! But wait a second. As with all the feedback matters, there are a lot of features that you should know about in order to get realistic results.
In this article, we'll talk about what a Customer Effort Score is and how to get not only a set of numbers, but also the best result.
Step 1: Find the right moment
It often seems that the more we "pave" customer journey with various surveys, the better it will be for the company. On the one hand, the idea is correct. The information obtained from each checkpoint can bring a lot of useful insights. On the other hand, it is important not to overdo it and find the right place and time for each survey. This rule works for all metrics, including CES.
To determine the correct points to use CES on the CJM, you must first find all the touch points. For example, if we are talking about e-commerce, then it may look like this:
- Product search;
- Selecting the right thing from the suggested options;
- Adding product to cart;
- Making a purchase.
Which of these four points is the best place to ask a CES question? The Customer Effort Score is most useful for routine interactions that need to be performed efficiently. So one of them will be the point after making an actual purchase. The user's responses will help you understand how successful their experience was and whether they encountered any difficulties along the way. If the client is disturbed by something, you can quickly find out about it and tackle the issue ASAP.
You can also use the CES survey effectively after the customer has used the search engine. Because if the user has already experienced difficulties at this stage, there will probably be no one to ask about the convenience of placing an order. So if you want to understand what is wrong with this step, then the question is: "How convenient is it to use search?".
Another situation that encourages you to measure CES is communication between the client and the support team. Speed plays the most important role in most basic support interactions. This is why Customer Effort Score is increasingly used as the main metric. It is a very good idea to ask the user a question after the dialog has been closed. For example, how easy it was to contact support.
By the way, the same goes for chatbots. In this case, you can specify how easy it was to use the "smart" assistant.
It is important to remember that CES is not about the overall impression of the company, but about individual steps of CJM. So don't use Customer Effort Score to find out how the user feels about the brand as a whole. Leave it to NPS.

Step 2. Create questions
In terms of questions, CES has one special feature. This is due to the basic "firmware" of this metric.
The Customer Effort Score was introduced to the public in 2010 along with a standard question: «How much effort did you personally have to put forth to handle your request?».
Soon, Gartner specialists discovered several difficult points:
- Users did not always understand the question correctly due to the complex wording, so the answers were irrelevant;
- The word "effort "was not always correctly translated into other languages, which sometimes caused confusion in foreign-language markets.
A few years later, it became clear that CES needed more flexibility to change the wording according to the situation.
However, it is important not to forget a few basic rules:
― The question should be unambiguous. The user should only be asked about the effort, and nothing else;
― The question must be translatable. Avoid using the word "effort", the meaning of which varies from language to language;
― Use a neutral tone and don't push customers to get the "right" answer. For example, you should avoid such constructions: "We know that it was easy to place an order. How easy was it?" This is a somewhat exaggerated example, but the point is clear. Do not distort the wording of the question, giving it a positive or negative connotation. Just ask what you need to know.
― Accompany the main question with an additional open question. Here the situation is similar to NPS, where additional questions help you understand why the user gives you this or that score. If, for example, it was difficult for them to place an order, an open question will give the customer an opportunity to tell what exactly went wrong.
Here are some examples of CES questions that you can use in your work:
"How convenient is the checkout process?"
"How easy was it to contact our support team?"
"How convenient was it to use the search?"
"How easy was it to solve the problem?"
"How easy was it to make an appointment?"
"How convenient was the booking process?"
Step 3: Select a scale
Difficulty in choosing a scale is another distinguishing feature of the Customer Effort Score.
In the classic version, users are offered the following five-point scale:
1 ― very easy
2 ― easy
3 ― neither
4 ― difficult
5 ― very difficult
Over time, one difficulty arose with it due to a double understanding. In this case, 5 is the worst score, because the user put in too much effort. But for most people, a five is the highest score, just like in school. Therefore, customers could just mindlessly click on the number 5, thinking that they thus appreciate the service. When this issue was detected, the survey went through a transformation procedure.
In its second version, the CES question asks customers to agree or disagree with the statement that the solution to the problem did not require any effort. In this case, users who "strongly agree" give a 5. And those who strongly disagree, click on the number 1.This version of the survey eventually became the most popular. It doesn't eliminate errors, of course, but there is definitely less confusion. In addition, the numbers can be replaced with emojis, which further simplifies the task.
But that's not all. Gartner Group suggests using an extended seven-point scale. Where 1 is "Very difficult" and 7 is "Very easy". In this case, the mechanism responsible for the perception of the top five as the best score is "disabled". Respondents also have more options for expressing their emotions. For example, if the user struggled with the order for two hours, then the usual "difficult" is clearly not enough here.
There are no strict guidelines for using a particular scale. However, options 2 and 3 are most popular, as they don't cause too many misunderstandings.
Step 4. Calculate
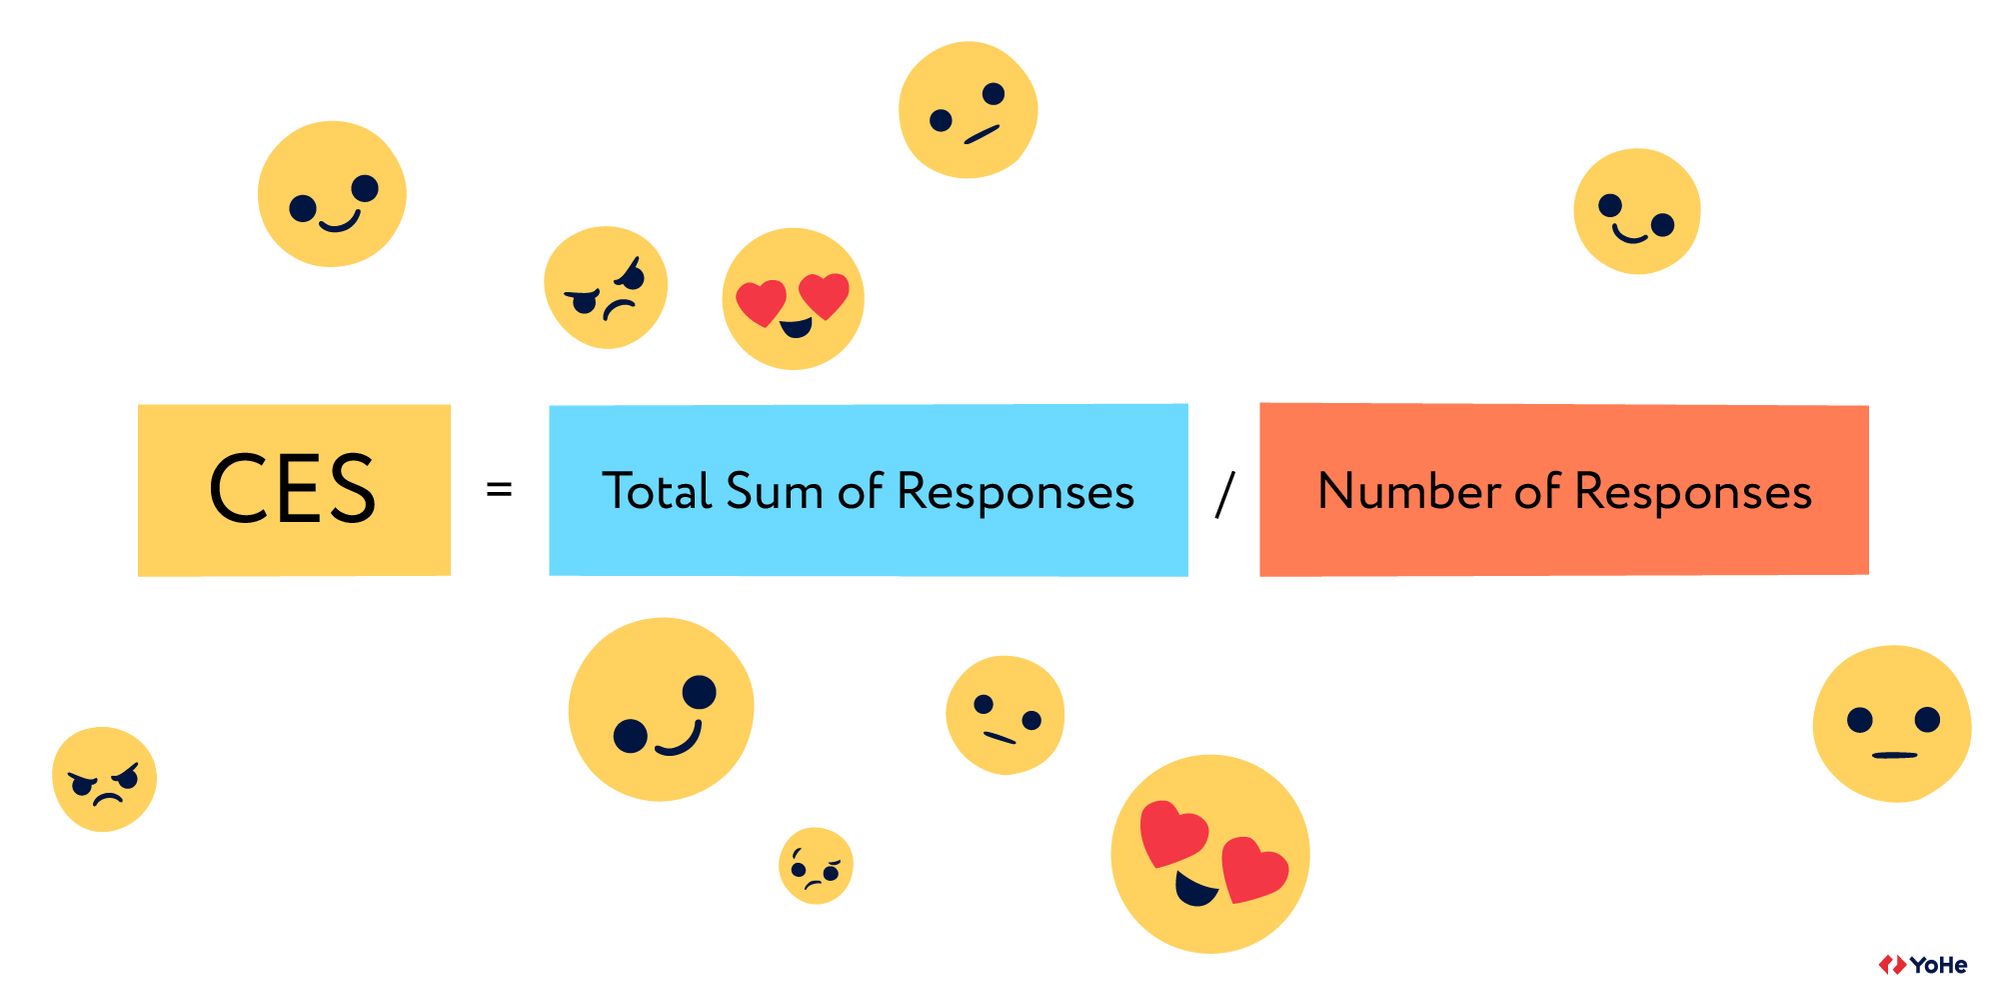
The CES calculation technology depends on the selected scale. However, there is one general working formula:

There is also a second option that corresponds to how NPS is calculated: promoters minus critics. Or, in this case, "strongly agree" minus "strongly disagree".
Gartner also suggests adding up the number of positive ratings (5-7) and dividing by the number of all ratings. In this case, CES will be presented as a percentage. One way or another, the decision on how exactly to extract the necessary numbers is up to the company.
Step 5. Get familiar with the benchmarks, but don't get hung up on them
To understand whether you are doing well or not, you need to look up to something. In the case of metrics, these are benchmarks. But with CES things are not so simple. Once upon a time, Gartner determined that the indicator below 70% is a reason to think. Well, if the Customer Effort Score was able to exceed 90%, then you are doing everything right.
However, these values can be considered quite approximate, because they do not take into account a specific industry (and this is an important factor for any metric), as well as the type of scale that was used in the survey.
The best tactic in this case is not to focus on the results of other companies, but to focus on internal dynamics. Simply put, compare your own numbers in certain time periods. If you don't track CES over a long distance, you'll never know if your customers are feeling better at the CJM points which were previously considered problematic.
Step 6. Don't forget the main thing
We keep saying that feedback for the sake of feedback is a bad idea. Going through all the steps of working with the CES survey, and then putting the extracted data "in the cupboard" is like stopping a couple of meters before the finish line. Since CES focuses on specific interactions, it will help you identify which ones require your immediate intervention and edits. This means that you can quickly fix the problem and make your users happy (just don't forget to "close" the feedback loop and let them know).
In addition, the statistics have some interesting numbers. For example, according to HBR research, the results of CES surveys are great predictors of future purchases. 94% of respondents who spent little effort to complete a key action then made repeated purchases. At the same time, 81% of respondents who spent a lot of effort on the purchase will tell their friends about the company in a negative way. So CES also allows you to understand how customers "advertise" a brand to others. The easier it is for them to perform key actions, the more likely they are to recommend you to their friends.


