The pattern of relationships between users and brands has changed a lot over the past decade. Now companies are not just selling goods and services, but are trying to provide a unique experience to the client. That includes involvement in various activities. It can be participation in loyalty programs, communication in social networks or content creation. All this can be combined under the concept of Customer Engagement (CE).
Customer engagement is an ongoing development of the relationship between a company and a client that goes far beyond the transaction. It's not a one-time operation or an event, but a system that shows value in every interaction with the user.
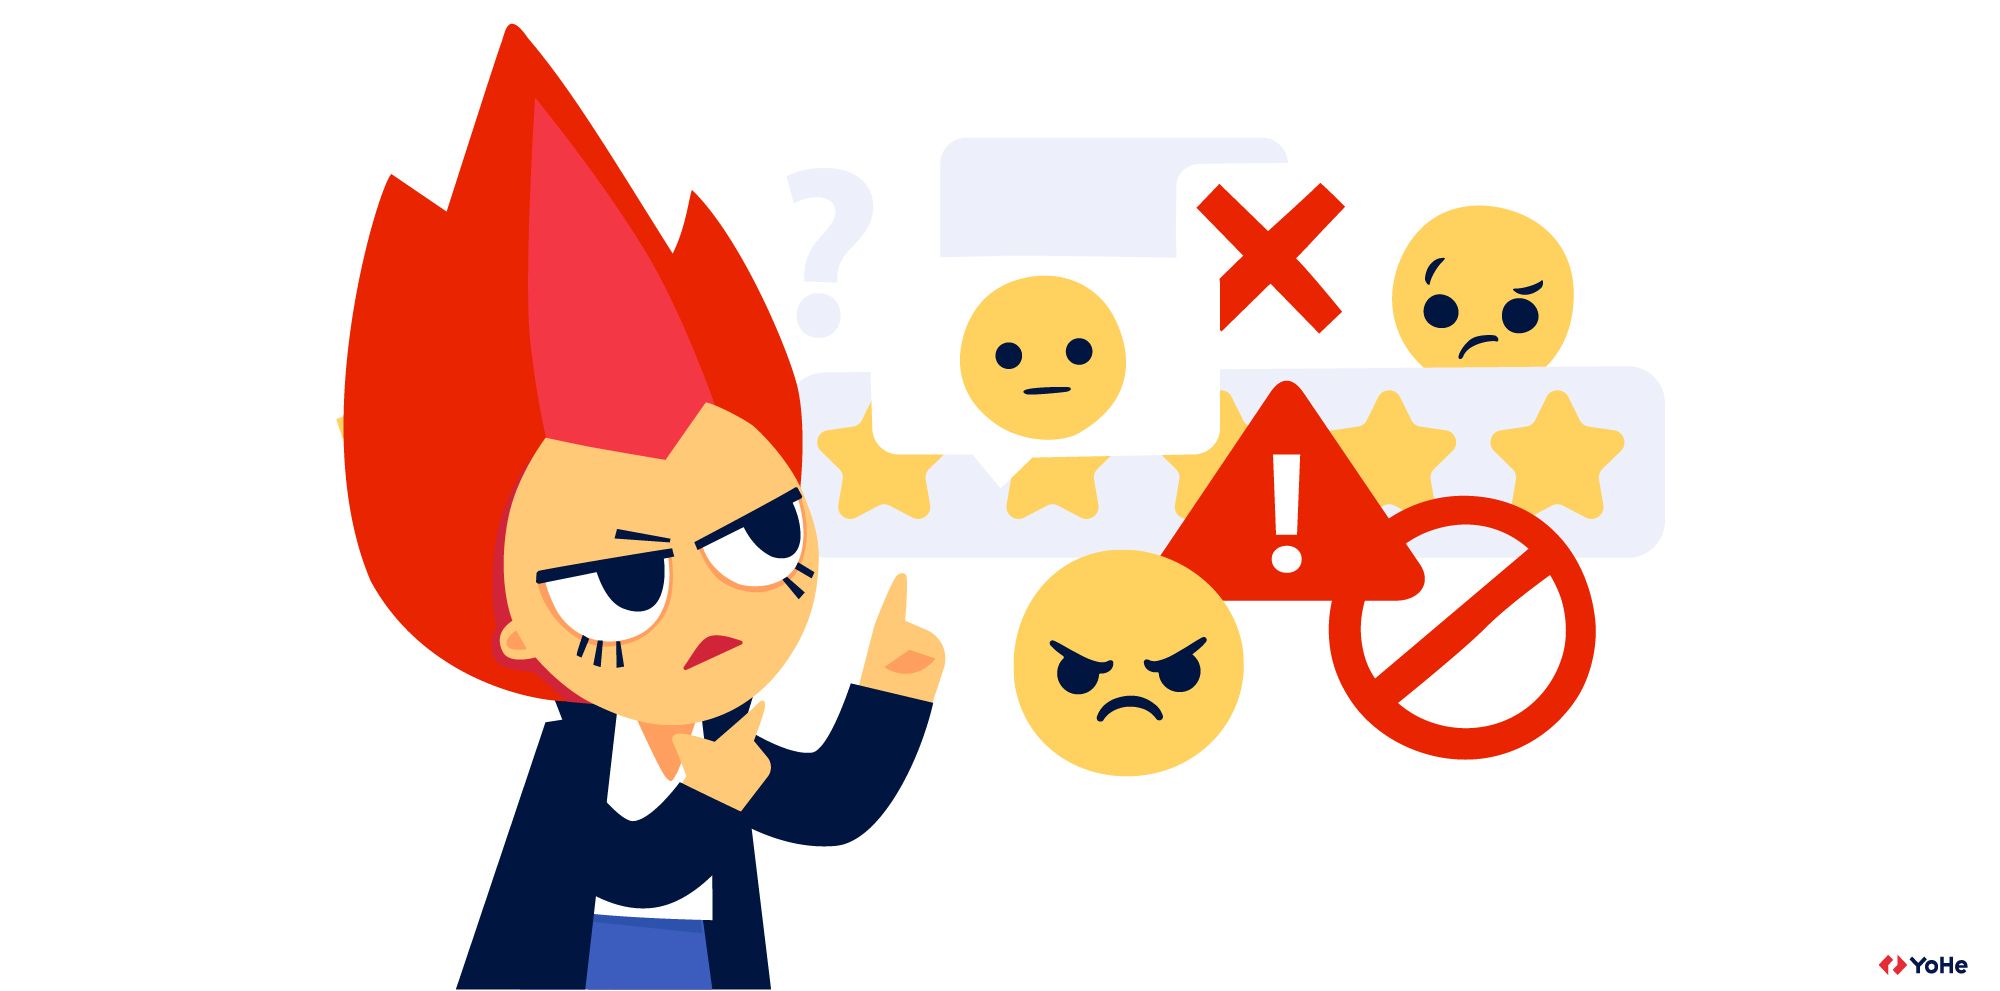
Sometimes engagement is confused with satisfaction or even customer experience. This is not totally wrong because they have much in common. But still there is one big difference. Engagement is first of all the perception that clients build up on everything they learn, see or hear about your brand. The objective of CE is to explore how customers interact with the company, what do they say about it in social media, how do they percept content and marketing activities and many more. So it's like having a big complex dialogue.
Engagement can be measured just like any other aspect of the brand-customer relationship. But in order to see the big picture, one metric is not enough. This will require a whole team.
We have compiled five different metrics (customer experience metrics, business metrics, and social metrics) that companies often use to work with engagement.
NPS – Net Promoter Score
Let's start with the main star of all measurements - Net Promoter Score. This metric is suitable for most tasks, although it cannot be called universal.
What it measures: Net Promoter Score is an index of customer loyalty. A metric shows a customer's attitude to your product or website and helps discover how likely they are to recommend you to their friends or relatives.
Why measure: NPS differs from many other loyalty metrics in that it learns the overall impression of a company or brand and not about individual sections of the user path.
Measuring NPS allows you to identify the company's critics and help them solve their problems by increasing the number of promoters.
How to measure: To measure the Net Promoter Score, you need to ask customers: "How likely are you to recommend our business to a friend or colleague?"
Users answer the question with a score on an 11-point scale – from 0 to 10. And one more note: often, when creating such surveys, other types of scales are used, for example, from 1 to 5. But such a metric cannot be considered NPS. Read about other errors when using the metric in the article.
The clients who have rated are divided into groups:
Critics (score 0-6) are dissatisfied customers who can bring you to sleepless nights and a couple of hair pulled out. They slow down the brand growth and launch word of mouth with unpleasant details about your site/product.
Neutrals (score 7-8) are usually satisfied but disinterested customers. They will ignore the offers, and the probability of their return to the site is 50/50. In addition, they can easily switch to competitors.
Promoters (rating 9-10) are loyal and so satisfied customers they will not only return to the site / buy more but also with a high probability will bring a couple of friends.
Now it is simple to calculate the Net Promoter Score:
The total percentage of critics – total percentage of promoters = NPS.
We will not talk here about the pros/cons and common mistakes associated with using NPS. You can read everything about it here and here.
CSAT – Customer Satisfaction Score
We have already said that satisfaction and engagement are not the same thing. Even the happiest user who has not changed the brand for years can remain quite indifferent to all related activities. Such customers do not subscribe to the company's social media accounts, do not leave reviews, and may not even register in the loyalty program. They are quite happy, but that's all.
The involved user, in turn, can use the services of the company only once, but they will definitely subscribe to the brand's Instagram and like each post. And still participate in all the activities.
However, a happy customer is more likely to become involved as well. So the CSAT metric still needs to be taken into account in the context of CE.
What it measures: CSAT is the metric designed to measure the level of customer happiness. It is probably the most popular metric for evaluating service and product quality in any business area.
Why measure: CSAT is the most popular CX metric for a reason. It combines the capabilities of both NPS and CES. As an NPS, it can measure the overall level of satisfaction with your product and, as a CES, how convenient individual sections of the user path are for the customer.
In the first case, you should interview users with a delay – not immediately after they have performed the target action. Some experts recommend sending a question to respondents quarterly or annually so that you constantly monitor changes in the assessment and notice dangerous trends.
But CSAT works best to get an answer here and now – whether the user is satisfied with the particular scenario: a call to support, a purchase on the site, or the use of a new feature.
How to measure: As a rule, CSAT is based on the question: "How satisfied are you with Company X?/How convenient was it to commit scenario X?" – with a scale from 1 – "Terrible" – to 5 – "Excellent." Specialists often replace numbers with emojis or stars. It does not affect the survey results and sometimes allows you to get more answers due to gamification.
To calculate the percentage of satisfied users, it is necessary to divide the number of satisfied respondents (who gave 4 or 5) by the total number and multiply by 100 percent.

CLV – Customer Lifetime Value
What it measures: A customer's lifetime value is the expected amount of money a customer can spend on your products during their lifetime.
Why measure: this figure allows you to decide how much money you need to attract new customers and how much to retain current ones.
For example, the CLV of the owner of a Ford car can be around 100 thousand dollars if he is satisfied with his purchase and acquires several other models during his lifetime. The coffee lover's CLV can be even higher, depending on how many cups of coffee he drinks daily and where he buys it.
If we take the concept of CLV more broadly, this is the potential profit that you can get from a specific relationship with a client. This metric gives you an understanding of whether the game is worth the candle. For example, if the client's CLV is 200$, do you need to spend more to keep him? It is simply unprofitable for you.
How to measure: CLV = average receipt * the number of times the user will make purchases in a year * the average length of the relationship with the customer (in years).
Customer Retention
What it measures: In contrast to the previous metric, retention is the ability of a company to maintain relationships with customers for some time. Retention is the percentage of customers remaining with you at the end of the selected period.
Why measure: retention not only shows the company's success in attracting new customers. It also shows the ability to satisfy current ones. In addition, it increases ROI and loyalty.
Here are a few reasons why retention is critical to your company's growth and success:
― Attracting a new client is 5-25x times more expensive than keeping the current one.
― A 5% increase in retention increases the company's revenue by 25-95%.
― "Saved" customers buy more often and spend more than new customers. They have internalized the values of a product or service and keep coming back again and again and again.
How to measure:
― Define a period (week, month, year).
― Determine how many active customers there were at the end of the selected period.
― Subtract from this the number of attracted new customers for this period.
― Divide the resulting number by the number of customers at the beginning of this period.
― Multiply by 100%.
Social listening metrics
Brand activity on social media contributes greatly to customer engagement. So monitoring all the basic platforms is a necessity, not just a "nice to have".
What is especially important:
― How many technical or account-related questions were left by users?
― How many comments provide any kind of feedback?
― How many questions can be answered using links to FAQ or any other help content?
― How many brand mentions require any kind of response?
― What time of day are your customers most active on social media?